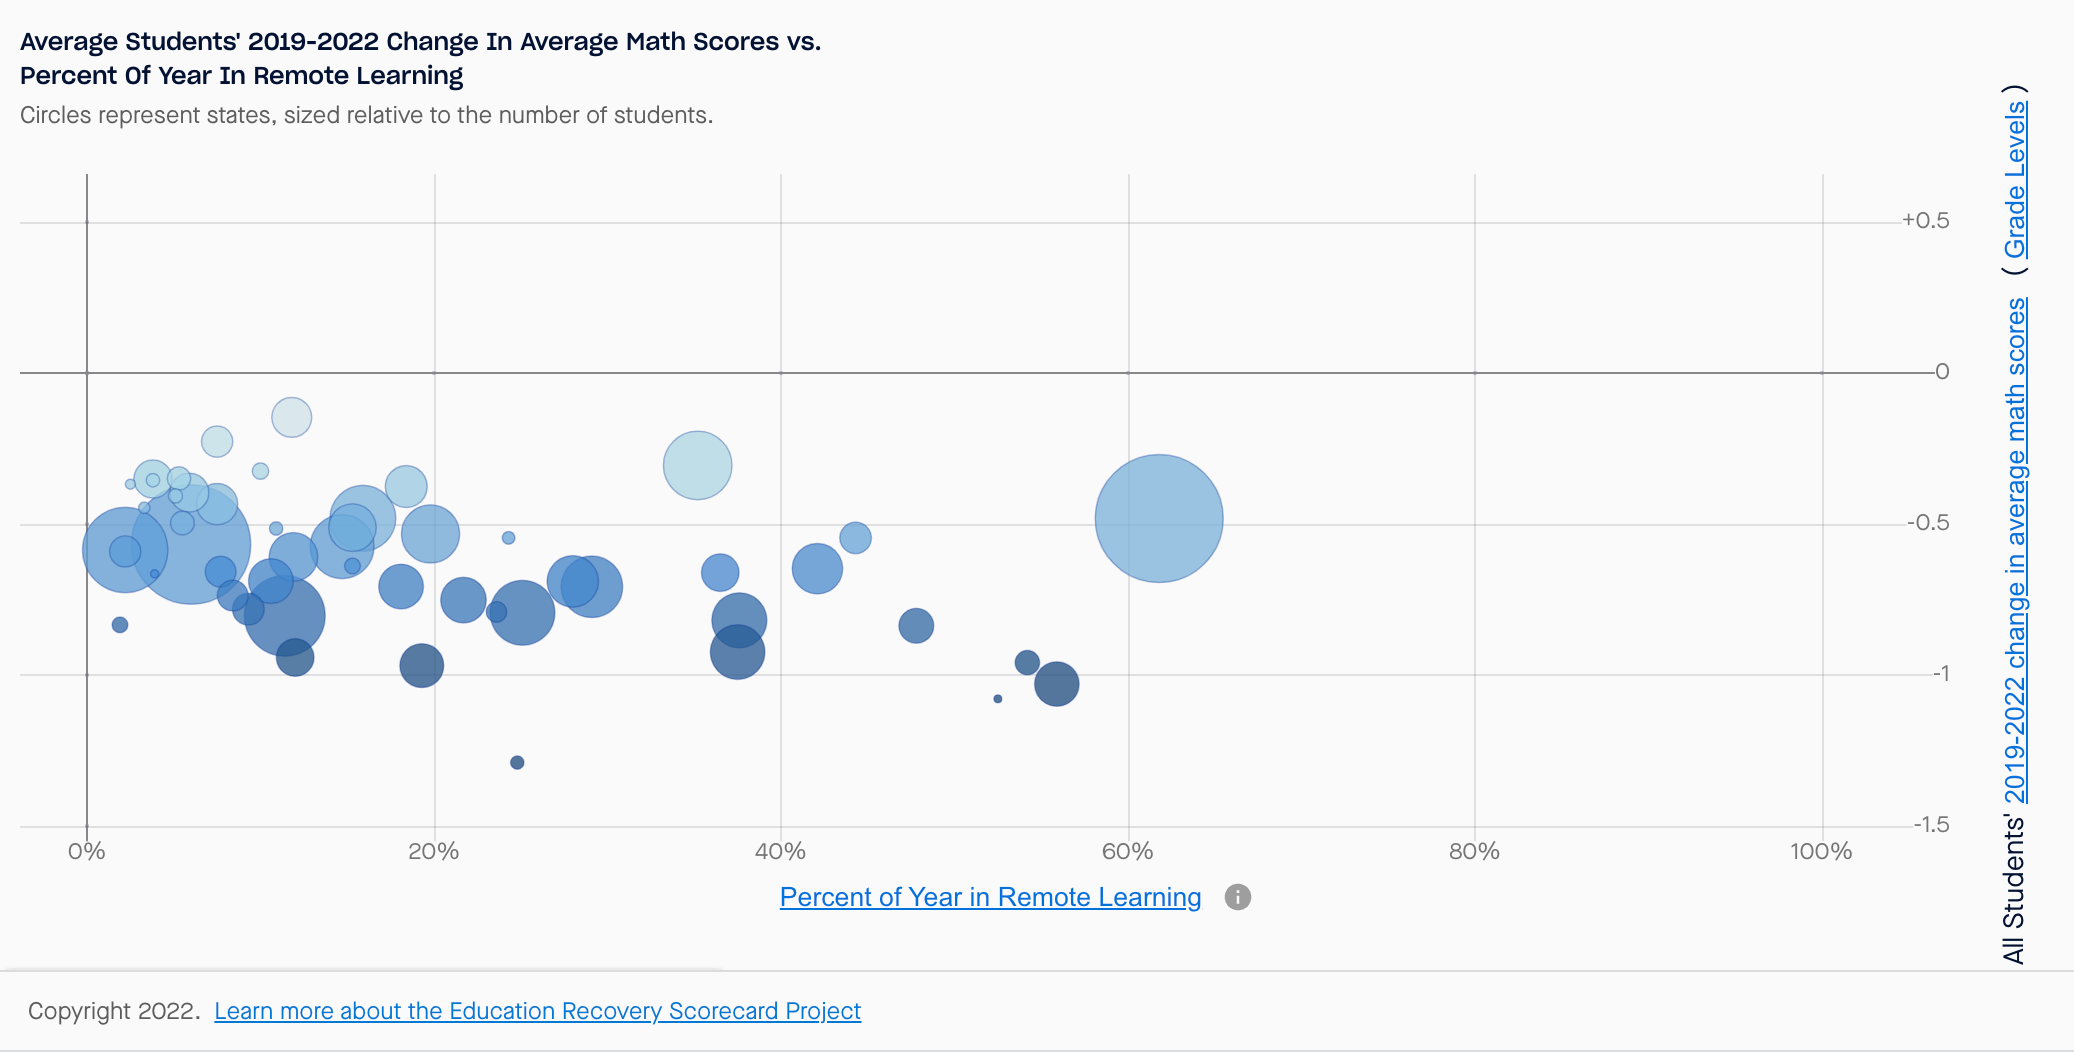
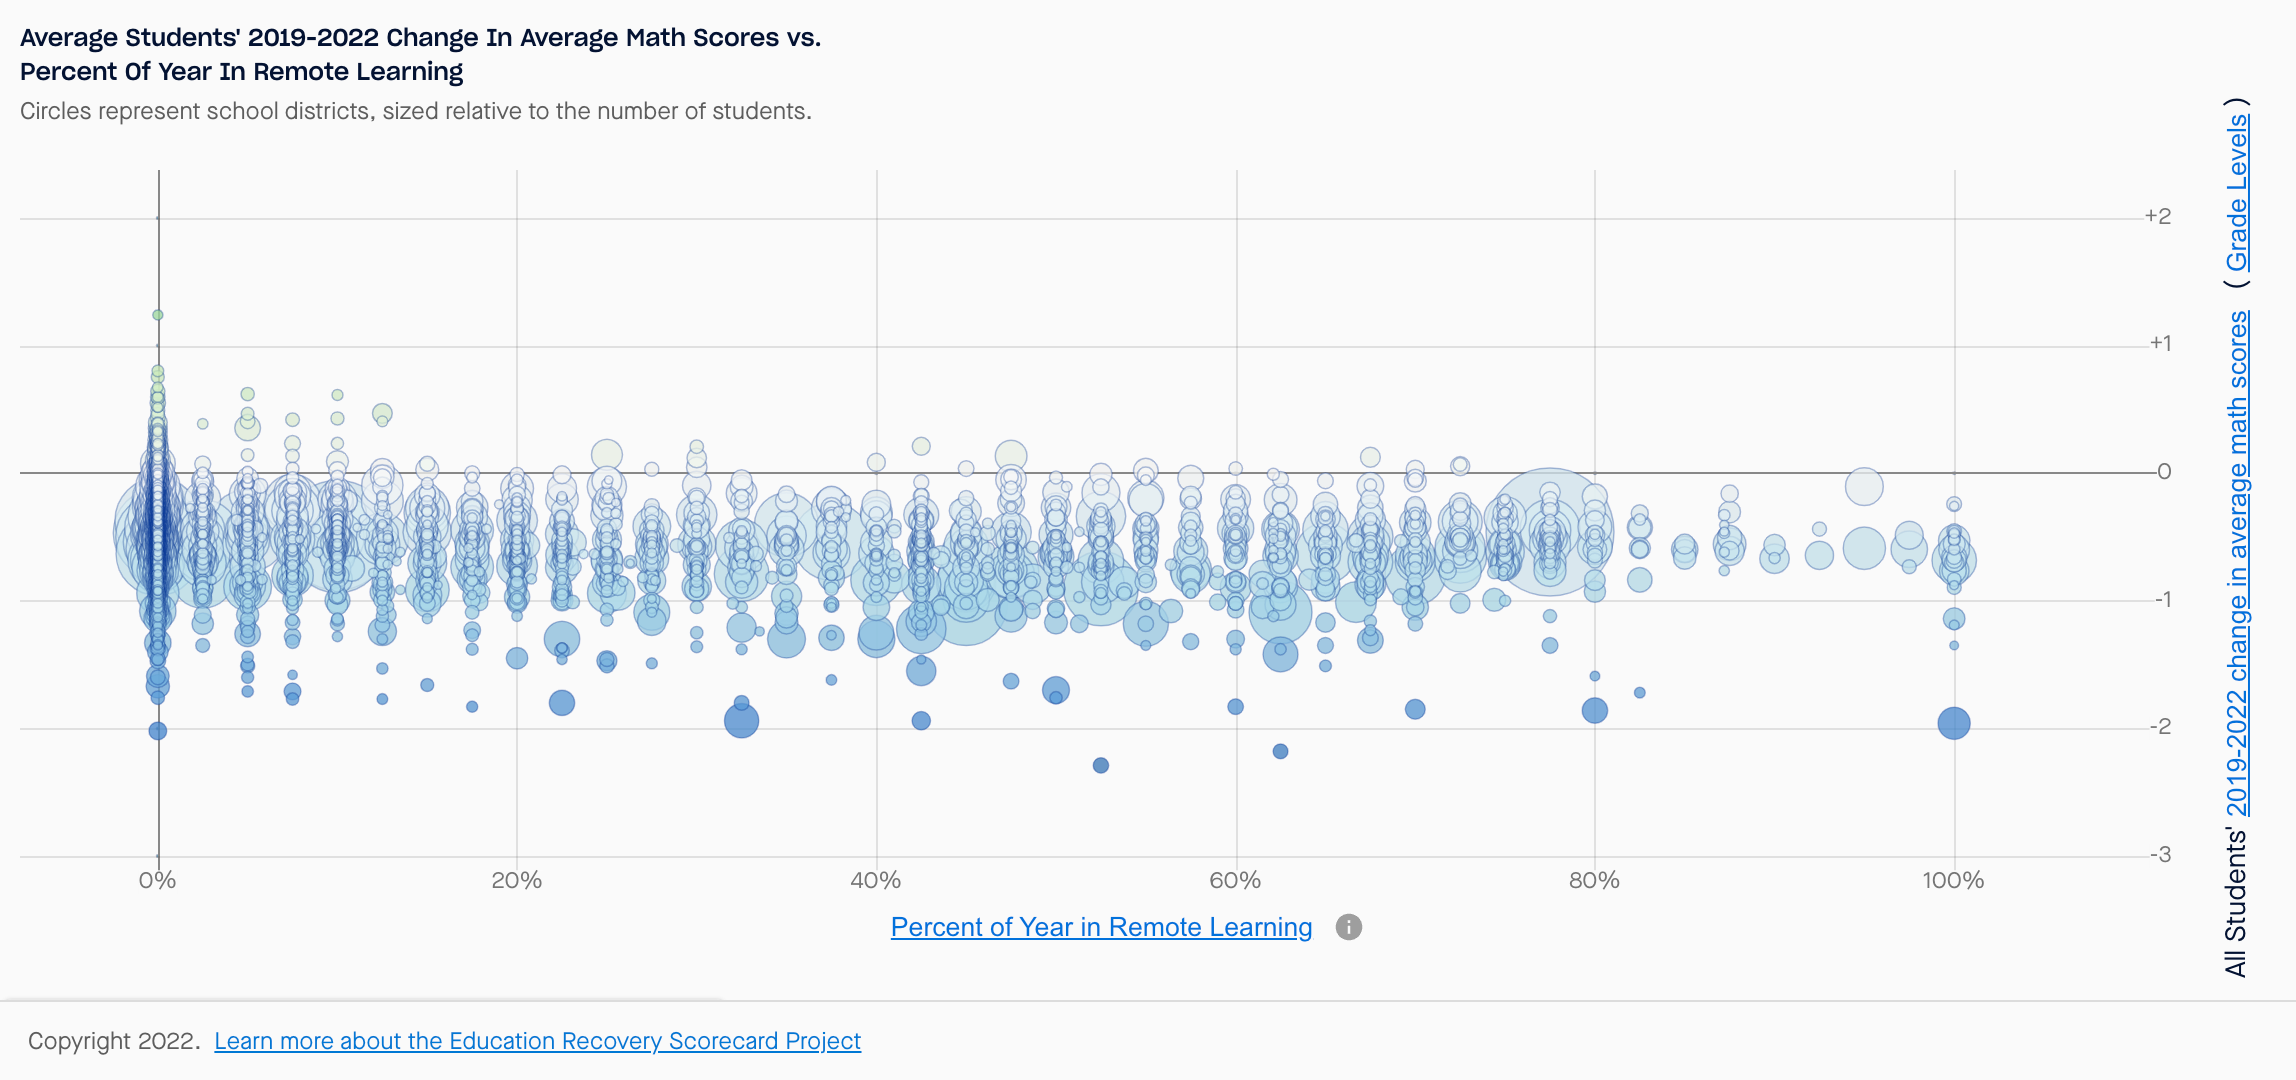
Our team at Learner-Centered Collaborative recently had a lively discussion about the results of recent research from the Stanford Educational Opportunity Project and the Harvard Center for Education Policy Research that I first saw on a blog post from Steve Rees. The post includes screenshots of graphics that visualize the percentage of time spent in remote learning on one axis and test score results on the other along with notes about demographics like free-reduced lunch percentages. Looking at the data by state and by district shows a clear trend – there is no visual relationship between these variables, suggesting that the percentage of time spent in remote learning was not the determining factor for the decline in test scores.
All of this leads to some common sense questions and a few that come to mind include:
- If the percentage of time in remote learning is not associated with the decline in test scores, what factors caused the setbacks?
- How is it possible that time in school or in remote learning did not contribute to the test scores results?
Perhaps less obvious is this one: Are we asking the right questions?
On the first question, the same Stanford site that created the visuals about remote learning also includes this stunning graphic:

This graphic indicates a clear relationship between test scores and socio-economic status.
Do you notice a clear relationship between the variables here? As we have seen over and over, test scores are clearly influenced by socio-economic status. The chart above is referencing tests in grades 3-8 and we see the same trends in other standardized tests such as the ACT which is used for college admissions.
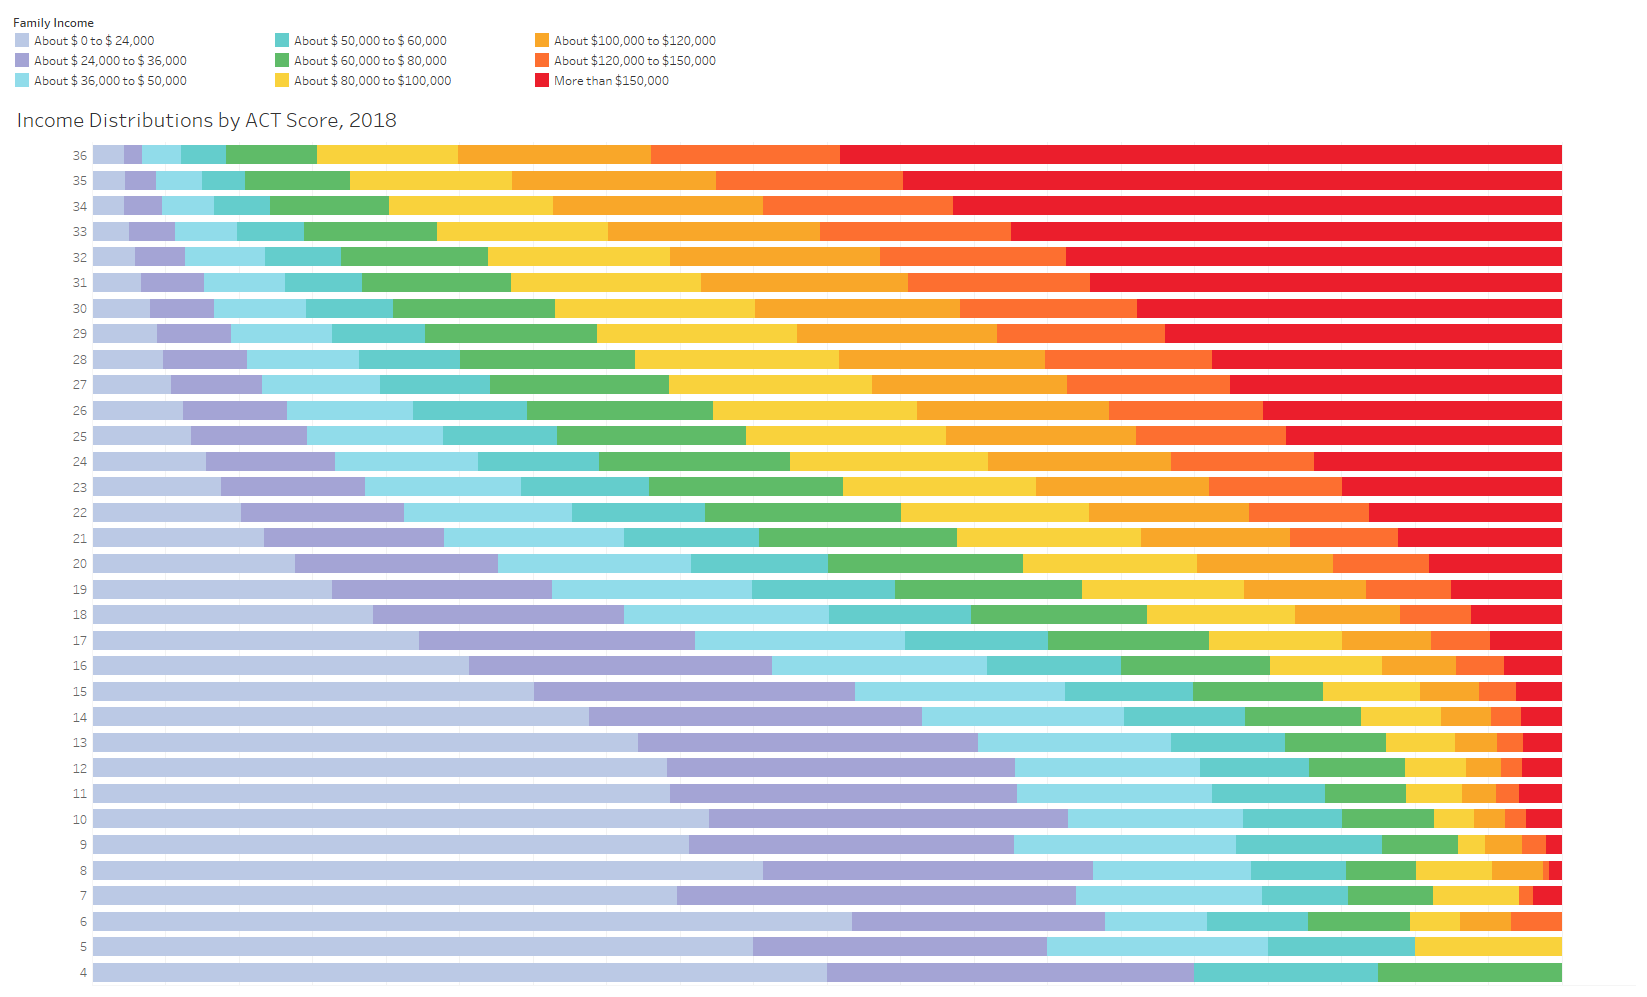
We see a similar correlation between ACT test scores and socio-economic status in this graphic shared by Jon Boeckenstedt.
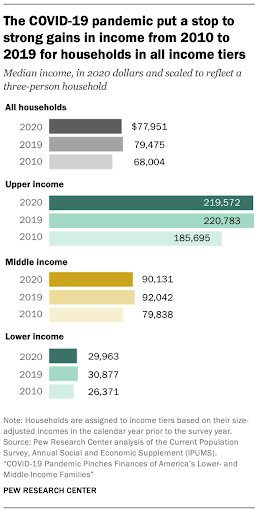
Image courtesy of the Pew Research Center
If we know that income and test scores are highly related, what happened to income during the pandemic? Unsurprisingly, the data shows that income dropped “in all income tiers” with unemployment benefits serving as the key source of income for more than 10% of all adults, a figure which was double the number from the year before the pandemic.
All of this leads to a very common sense conclusion that the pandemic caused economic distress which led to a decline in test scores. This can be further explained by the challenges associated with poverty that include adverse effects on wellbeing and security. Perhaps more controversial is the conclusion that standardized test scores really aren’t measuring learning to begin with, a line of logic that certainly explains why we see no relationship between in-person and virtual experiences.
If in fact these standardized test scores are simply a proxy for economic status and not an actual representation of learning, we should also be asking what information we should be reviewing to evaluate learning and the efficacy of our educational efforts.
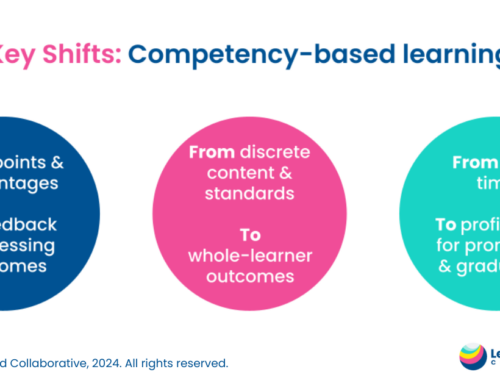
While it may be contrarian, we take the view that we should be promoting an inside-out approach that begins with learners and that we should utilize an inclusive process where local priorities are identified in the form of a “Framework for the Future” that includes a holistic learner profile. This is the best way to build on the unique strengths, interests, values, and identities of individuals and communities and it is clearly a more productive path than what we have been doing. It’s time to stop asking the wrong questions so that we can devote our energies to co-constructing learning ecosystems that empower all learners to know themselves, thrive in community, and actively engage in the world as their best selves.
Learn about the what, why and how of a Framework for the Future in this 15 minute, special edition podcast episode. Listen now