Scorecards: How Might We Measure What Matters In Schools?

There are many good reasons to have ways to determine if a school or school system is effective. For one, our schools are preparing our young people to be productive contributing citizens and (hopefully) thriving adults, so best to measure efficacy before it is too late. In addition, schools drive a culture of ongoing improvement; there are significant implications for attracting and retaining students, families, and staff; and, policy makers often use determinations to make decisions regarding funding and resource allocations.
The problem is that we have relied on an externally-driven, “one size fits all” model for school accountability that has been overly reliant on standardized test scores and does not honor the local context and the inherent variations among schools that serve a wide range of ages with distinct learning goals. Success for a kindergarten student at a dual-language immersion school is fundamentally different from success for a high school senior who is attending a STEM-focused school with extensive work-based learning experiences.
The truth is that the current system is not working. In more than two decades since No Child Left Behind (NCLB) established the core of the current model and with its successor The Every Student Succeeds Act (ESSA) which provided some additional flexibility to states to add metrics we have not seen systemic improvements. In fact between the first two ESSA improvement cycles (2016-2020 and 2020-2024) there’s been a 31% increase in the number of public schools now in corrective action. When the number of schools not meeting the criteria for success is rising, we must question the criteria and the approach itself which clearly is not generating the desired results.
Lessons from golf, team sports, and manufacturing
In today’s ever-evolving educational landscape, the definition of success can vary greatly from one school to another. Just like in sports or manufacturing, where different metrics and indicators measure progress and achievement, schools and school systems must also adopt a nuanced approach to assessing their effectiveness.
Golf scorecards
In golf, players strive to complete a course in as few strokes as possible, aiming to match or beat the predetermined Par score for each hole. Par is indicated on the scorecard and represents the expected performance level for a particular hole based on its length and complexity. Schools could leverage a similar model where performance targets are established based on the distinct context and opportunity in their environment. This approach acknowledges that success varies depending on what is unique to each educational institution.
Team sport scoreboards
In team sports the scoreboard is a dynamic reflection of the game’s progress. It shows not only the current score but also the time or amount of play remaining in the game. This information is crucial for coaches and players to strategize effectively. Similarly, schools need indicators to gauge their progress and make informed decisions. Tracking key milestones and deadlines allows educators to adjust their strategies as needed to achieve their goals.
Developing a Framework for the Future is a key process schools and districts use to get clear about goals and outcomes to inform scorecards. Learn more in What Is a Framework for the Future and Why Do You Need One?
Manufacturing dashboards

In manufacturing the use of dashboards is an established way to make performance quality clear and to create a culture of continuous improvement. The dashboard provides a comprehensive view of critical performance indicators, allowing teams to monitor progress and identify areas needing improvement. Similarly, schools can adopt a dashboard approach by defining key organizational goals and regularly assessing progress. The dashboard model promotes a culture of continuous improvement by making performance quality visible and ensures that schools remain vigilant in pursuing their mission.
Tailoring Success Metrics for Educational Context
The golf scorecard, team scoreboard, and manufacturing dashboard approach offer valuable insights into the importance of context-specific metrics for assessing success in education. By establishing success metrics, monitoring progress in real-time, and implementing a dashboard system that focuses on organizational goals, schools and school systems can navigate the complex modern educational landscape effectively. In addition, we can draw inspiration from simple, easy-to-understand interfaces that promote common understanding and inform potential next steps by providing relevant and important information.
As we recognize that the metrics of success in education are as diverse as the schools themselves, it becomes clear that a one-size-fits-all approach to assessment is inadequate. Just as other environments require tailored metrics, so too does education. By embracing these diverse models, educators can better understand and measure success in the ever-changing world of learning.
Learner-Centered Collaborative Scorecards
By integrating elements of models from other settings and based on our experiences working with diverse learning communities, we have established a template for a school (or school system) scorecard that incorporates the most relevant and impactful elements of these models.
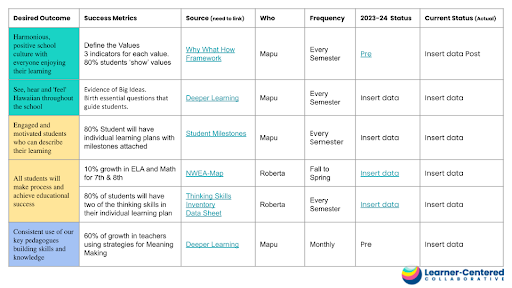
Our Learner-Centered Collaborative Scorecard includes desired outcomes, success metrics, sources, and status updates. We have also found it helpful to organize the Scorecard into “Pillars of Success” such as whole-learner outcomes, academic outcomes, culture and climate, and teaching and learning. Following are a few examples of scorecards we have developed with partners.
Logan County Schools (KY)
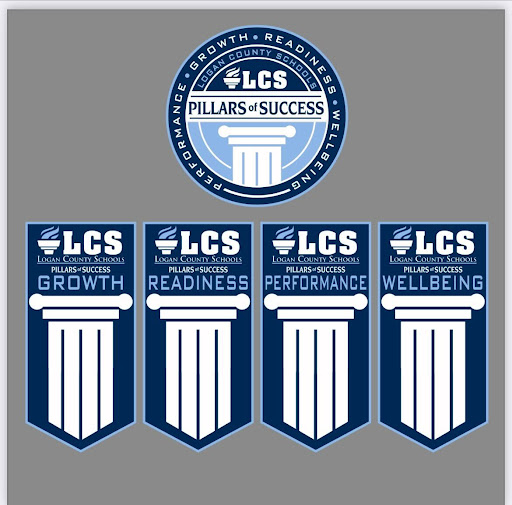
Logan County Schools in Kentucky uses growth, readiness, performance, and wellbeing as their “Pillars of Success” and they have established success criteria for each.

Hampton Township (PA)
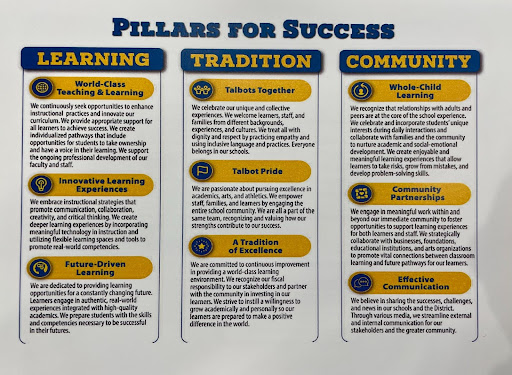
Hampton Township in Pennsylvania has adopted learning, tradition, and community as their Pillars for Success. These are incorporated into an aligned strategic plan that was co-developed through design thinking by a broad group of community representatives in a process that also leveraged extensive surveys to ensure that diverse perspectives were considered.

Hawaii Public Charter School Commission
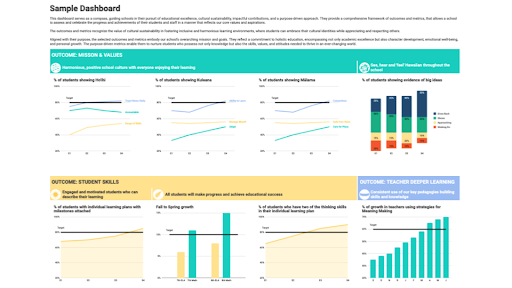
We are currently partnering with the Hawai’i Public Charter School Commission to co-design scorecards for a network of Hawai’i focused schools. This process begins by referencing the school vision, mission, and values. In collaboration with a data visualization consultant, we can then convert the scorecards into dashboards that help to make patterns and trends apparent. While this is still a work in progress, we are excited about the potential to measure what matters in schools and to make performance quality visible, thereby creating the conditions for ongoing improvement to help achieve the aspirations of learners and communities.


Just as the map is not the territory, the dashboard is not the destination. The real work is on the field and we must continue to focus on what matters most for learners. Learner-centered scorecards represent an opportunity to better understand progress over time through shared indicators of success that reflect our shared aspirations in context and in community. Anything becomes possible when we listen to learners, support vision to implementation, measure what matters, co-design and model, lead with an inclusive approach, and celebrate learning. Let’s work with one another to create new systems to make learning visible and hold ourselves accountable to our commitments to one another. This is the way to a brighter future for all.
What might measuring school or system success look like in your context? Schedule a free consultation with our team here.


