Measuring What Matters to Enable Meaningful Learner-Centered Change in Your School or District
When we talk about measuring impact, we can look at it through multiple lenses. There’s the impact on an individual learner (young people and adults)—how they’re growing, what competencies they’re developing, and how they perceive their own progress. Then, there’s the impact on the systems (e.g. programs, schools, districts)—how they’re evolving, what conditions are enabling or constraining change, and how the collective experience of educators and learners reflects progress toward the shared vision.
Understanding the whole picture is complex. Individual and collective learning, along with the systems that enable it, contain countless interacting variables. To honor this complexity, we need to measure what matters, not what’s easy or most efficient.
To learn more about how we work with schools and districts to measure what matters most, check out our “Measure Impact” section at the bottom of this page.
To spark our creativity and innovation, it’s valuable to go beyond the educational context and explore examples and practices in other fields. In particular, we should seek examples that are unfamiliar and reflect on how they might be relevant to our context. So, let’s step outside of education for a moment to explore other fields where the complexity of what contributes to meaningful success is present and how people in those fields have made meaning of the data at their disposal.
Learning from Other Fields
In both sports and finance, analytics has transformed how decisions are made. Take baseball. For decades, scouts relied on subjective observation to assess players. Then came sabermetrics—the data-driven approach that took the game by storm after an underfunded team, the 2002 Oakland Athletics, was able to compete with teams that were spending tens of millions more for their players.
This story, popularized in Michael Lewis’s Moneyball, wasn’t about measuring more. It was about measuring what mattered most: how individual actions contributed to team wins. Once teams like the Red Sox and Cubs adopted these analytics, they broke century-long championship droughts because they aligned player decisions with evidence of what drove success.
The same evolution has happened in finance. Just as baseball scouts once relied almost entirely on in-person observation and gut feel to assess players, for decades, financial investors relied heavily on surface-level financial metrics and simplistic rule-of-thumb ratios to assess companies.
Today, their analysis has shifted toward deeper, more holistic, data-driven models that integrate forward-looking analytics, alternative data sources, and system-wide patterns of performance. This shift allows investors to better evaluate the true value of companies.
Education, in many ways, is at a similar inflection point. We have new tools and computational power that can help us see patterns across learners, experiences, and outcomes in ways that were once impossible. But unlike sports or finance, the goal isn’t profit or victory, it’s human flourishing. And that means we must take care not to let the data overshadow learners but instead center them.
Balancing Quantitative Evidence and Qualitative Experience Through a Mixed-Methods Approach
When systems over-index on quantitative data, we risk losing sight of the human experience behind the numbers. The No Child Left Behind era taught us that focusing on a single metric is problematic. Just because something is easy to measure doesn’t mean it captures what matters most.
The future of impact measurement in education lies in mixed methods—valuing both quantitative and qualitative evidence. Numbers can show us trends, while stories, reflections, and relationships reveal meaning. Together, they help us understand whether or not change is happening, why it’s happening, and how it feels to those experiencing it.
When I was a superintendent implementing new technologies across dozens of schools, we used a mixed-methods approach to inform systemwide decisions. One example included a simple three-part test before scaling any technological tool:
- Was it interoperable—able to integrate with other systems and share data effectively?
- Did it produce positive outcomes for learners?
- How did educators experience it?
If a tool met only one or two of those criteria, we didn’t move forward. We learned that impact is multidimensional and that valuing results and experience builds trust and sustainability. This experience also reinforced the need to take a mixed‑methods approach when determining scaling strategies, particularly in the context of adaptive change, where flexibility and responsiveness are essential for sustained progress.
A Note on Technological Infrastructure
Even as we advance in how we think about measurement, our infrastructure hasn’t always kept up. Many districts still operate with siloed systems. Student data lives in one place, employment data in another, and for some, files live in calendar year (not academic year) folders. This makes even basic questions, like how teacher credentials correlate with learner outcomes, difficult to answer.
Fortunately, new technologies, including AI, are starting to bridge those gaps. We’re approaching a point where disparate data sets can be integrated to provide a holistic view of learning, freeing up time for making meaning together. Again, the goal is not more data; it’s more insight.
From Measurement to Momentum
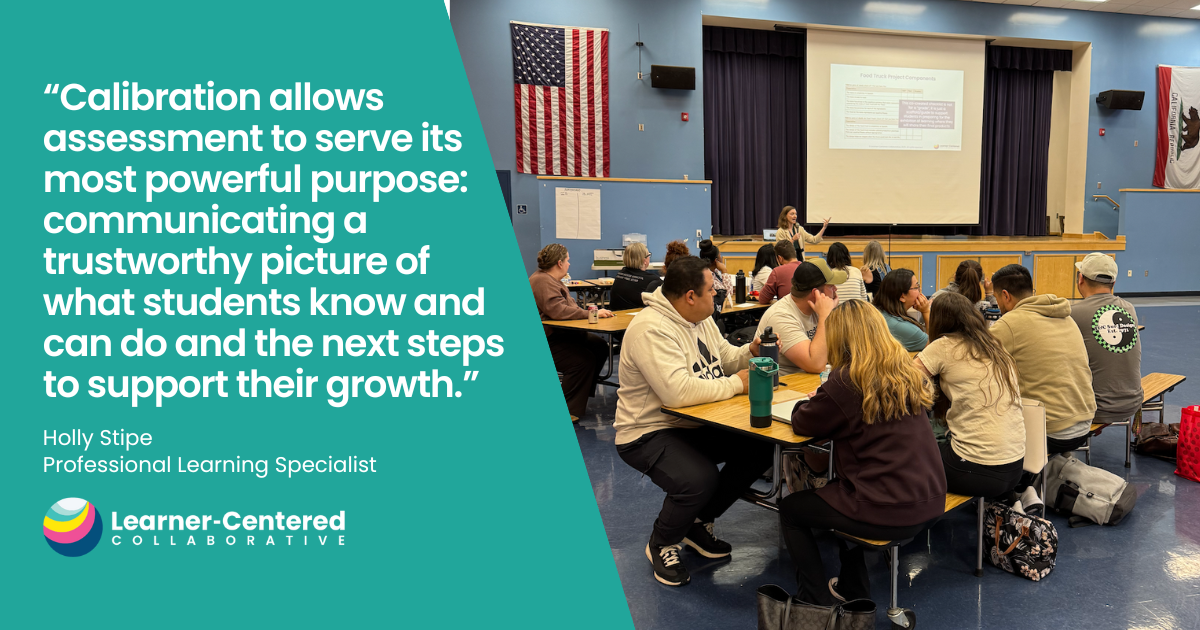
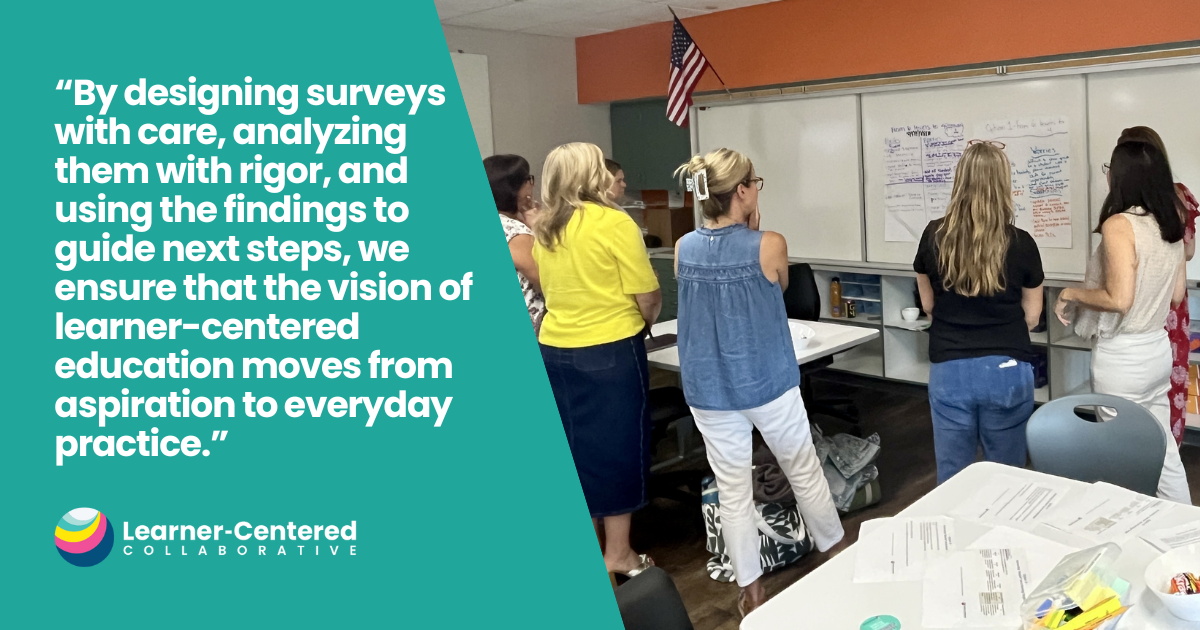
Learner-Centered Collaborative is leading the charge when it comes to how we can measure what matters most. Through our work with Impact Surveys and Scorecards, our partner districts are collecting data that improves a sense of collective efficacy and builds confidence that their change efforts are leading to meaningful impact.
Two examples of this approach can be found in Northern Cass School District and Del Mar Union School District. The data being gathered aligns with each district’s outcomes and their unique visions, missions, values, and Portraits of a Learner.
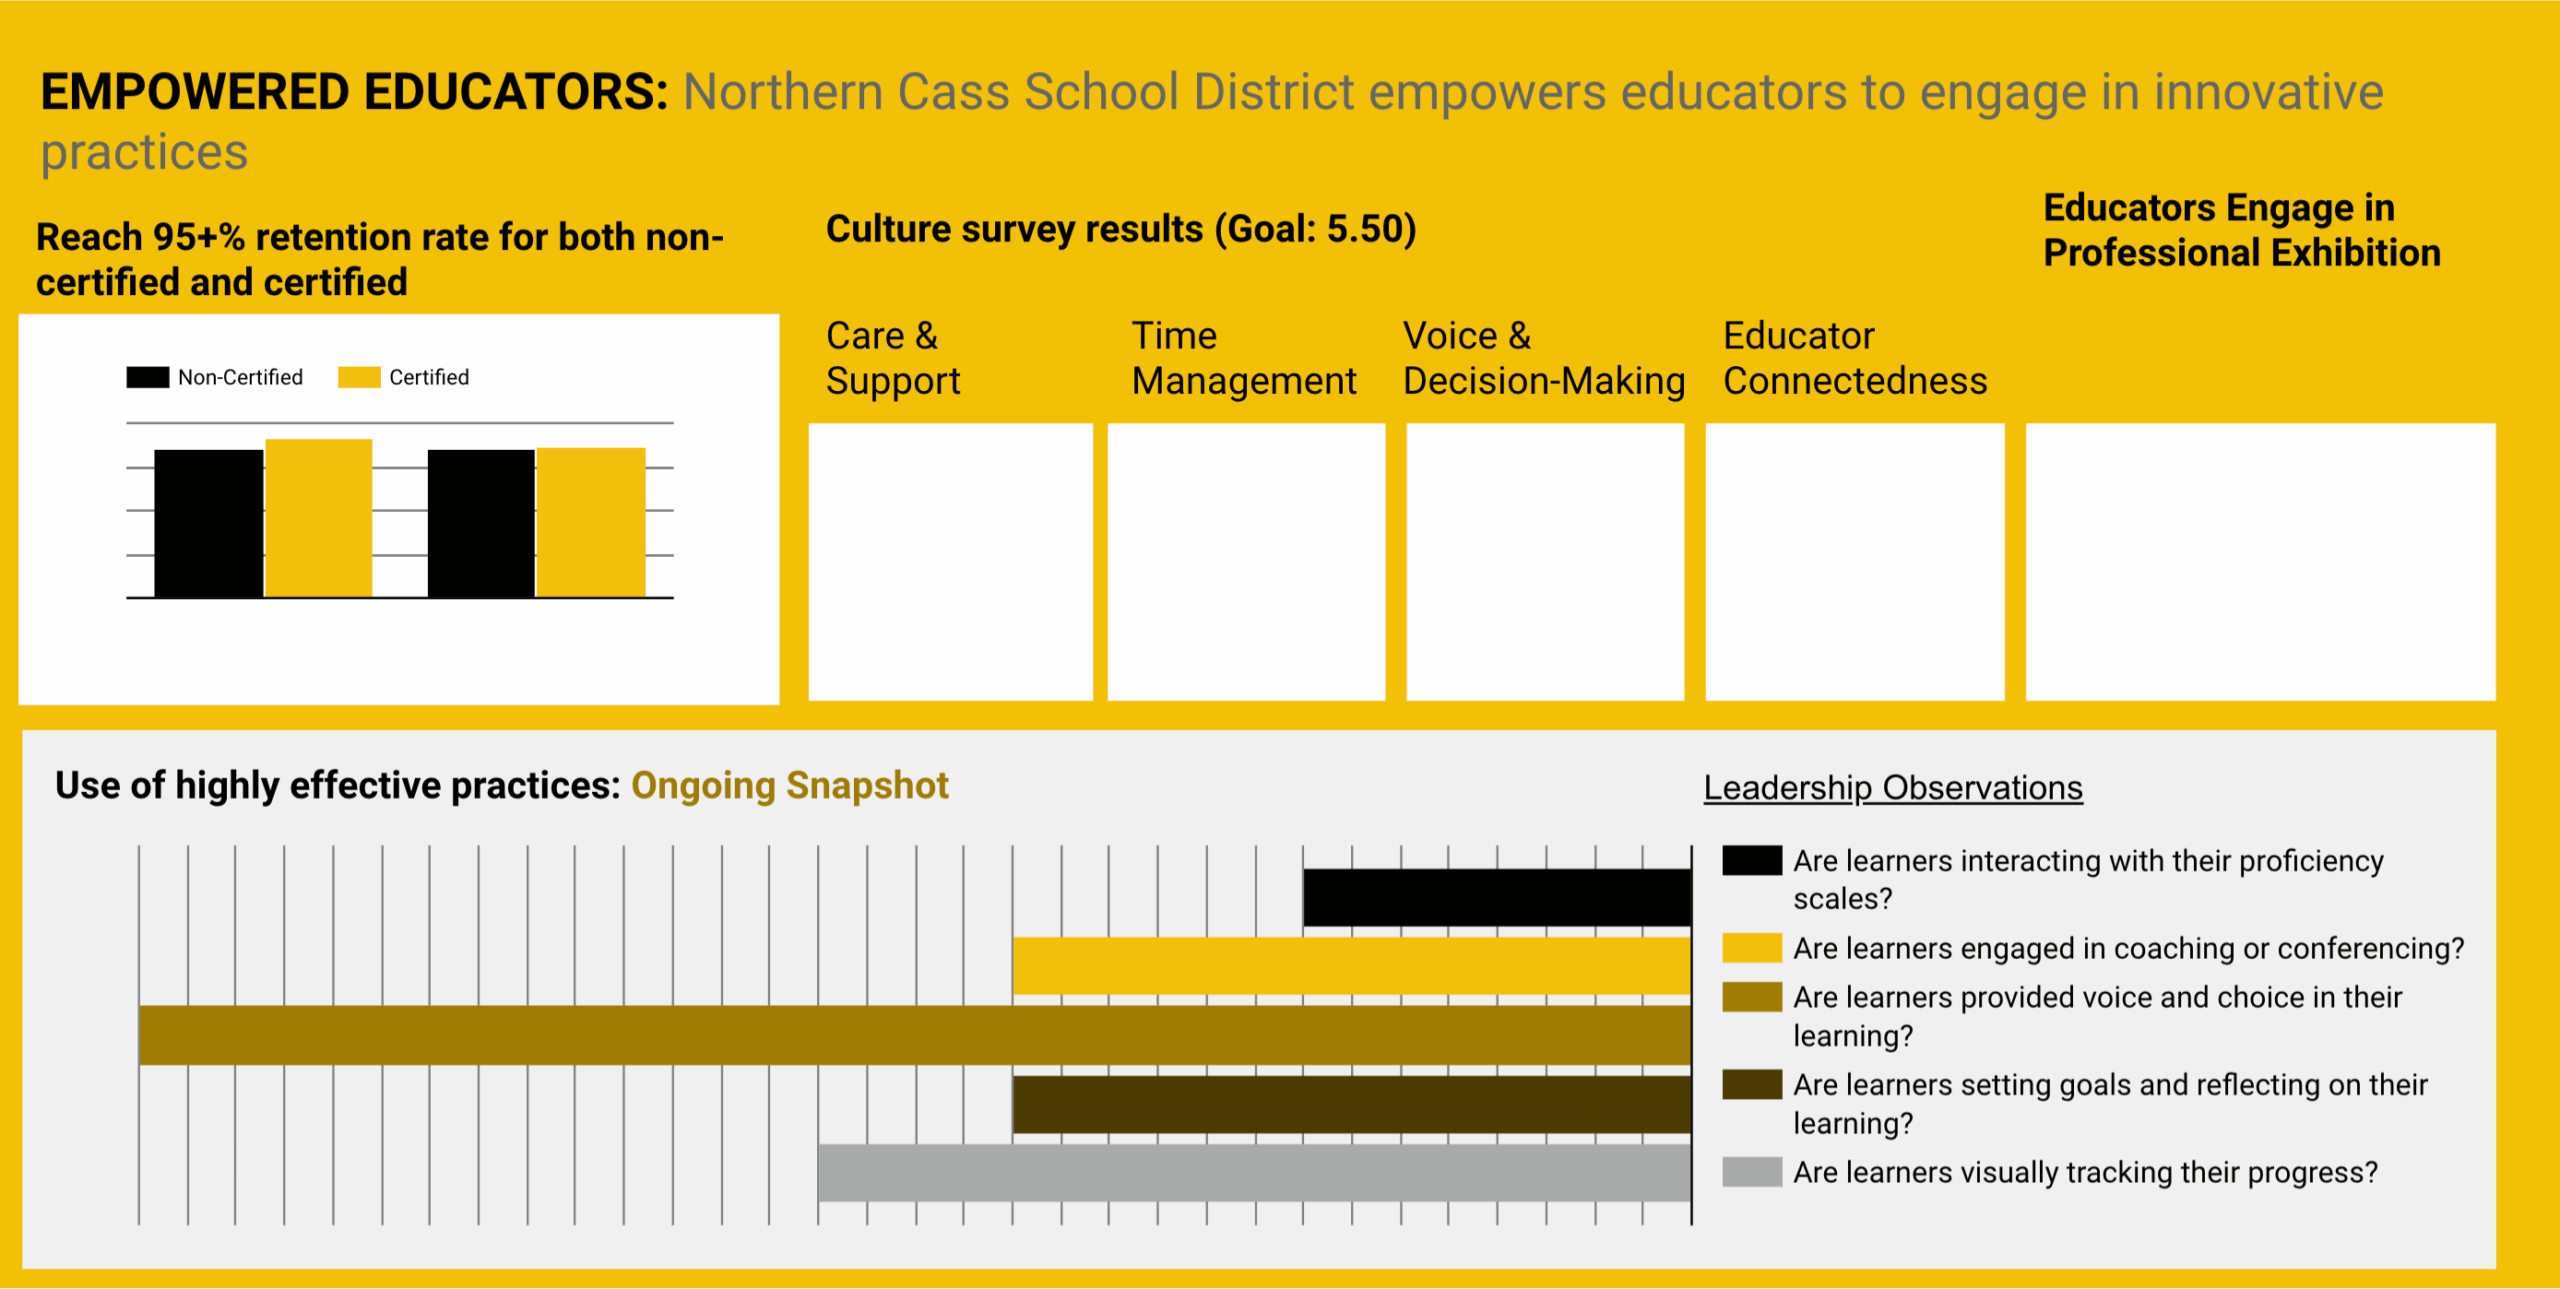
In Northern Cass, one of their outcomes includes “empowering educators to engage in innovative practices.” To measure progress toward that outcome, they are tracking educator retention and participation in professional exhibitions, conducting culture surveys, and looking for five specific bright spots within classroom settings.
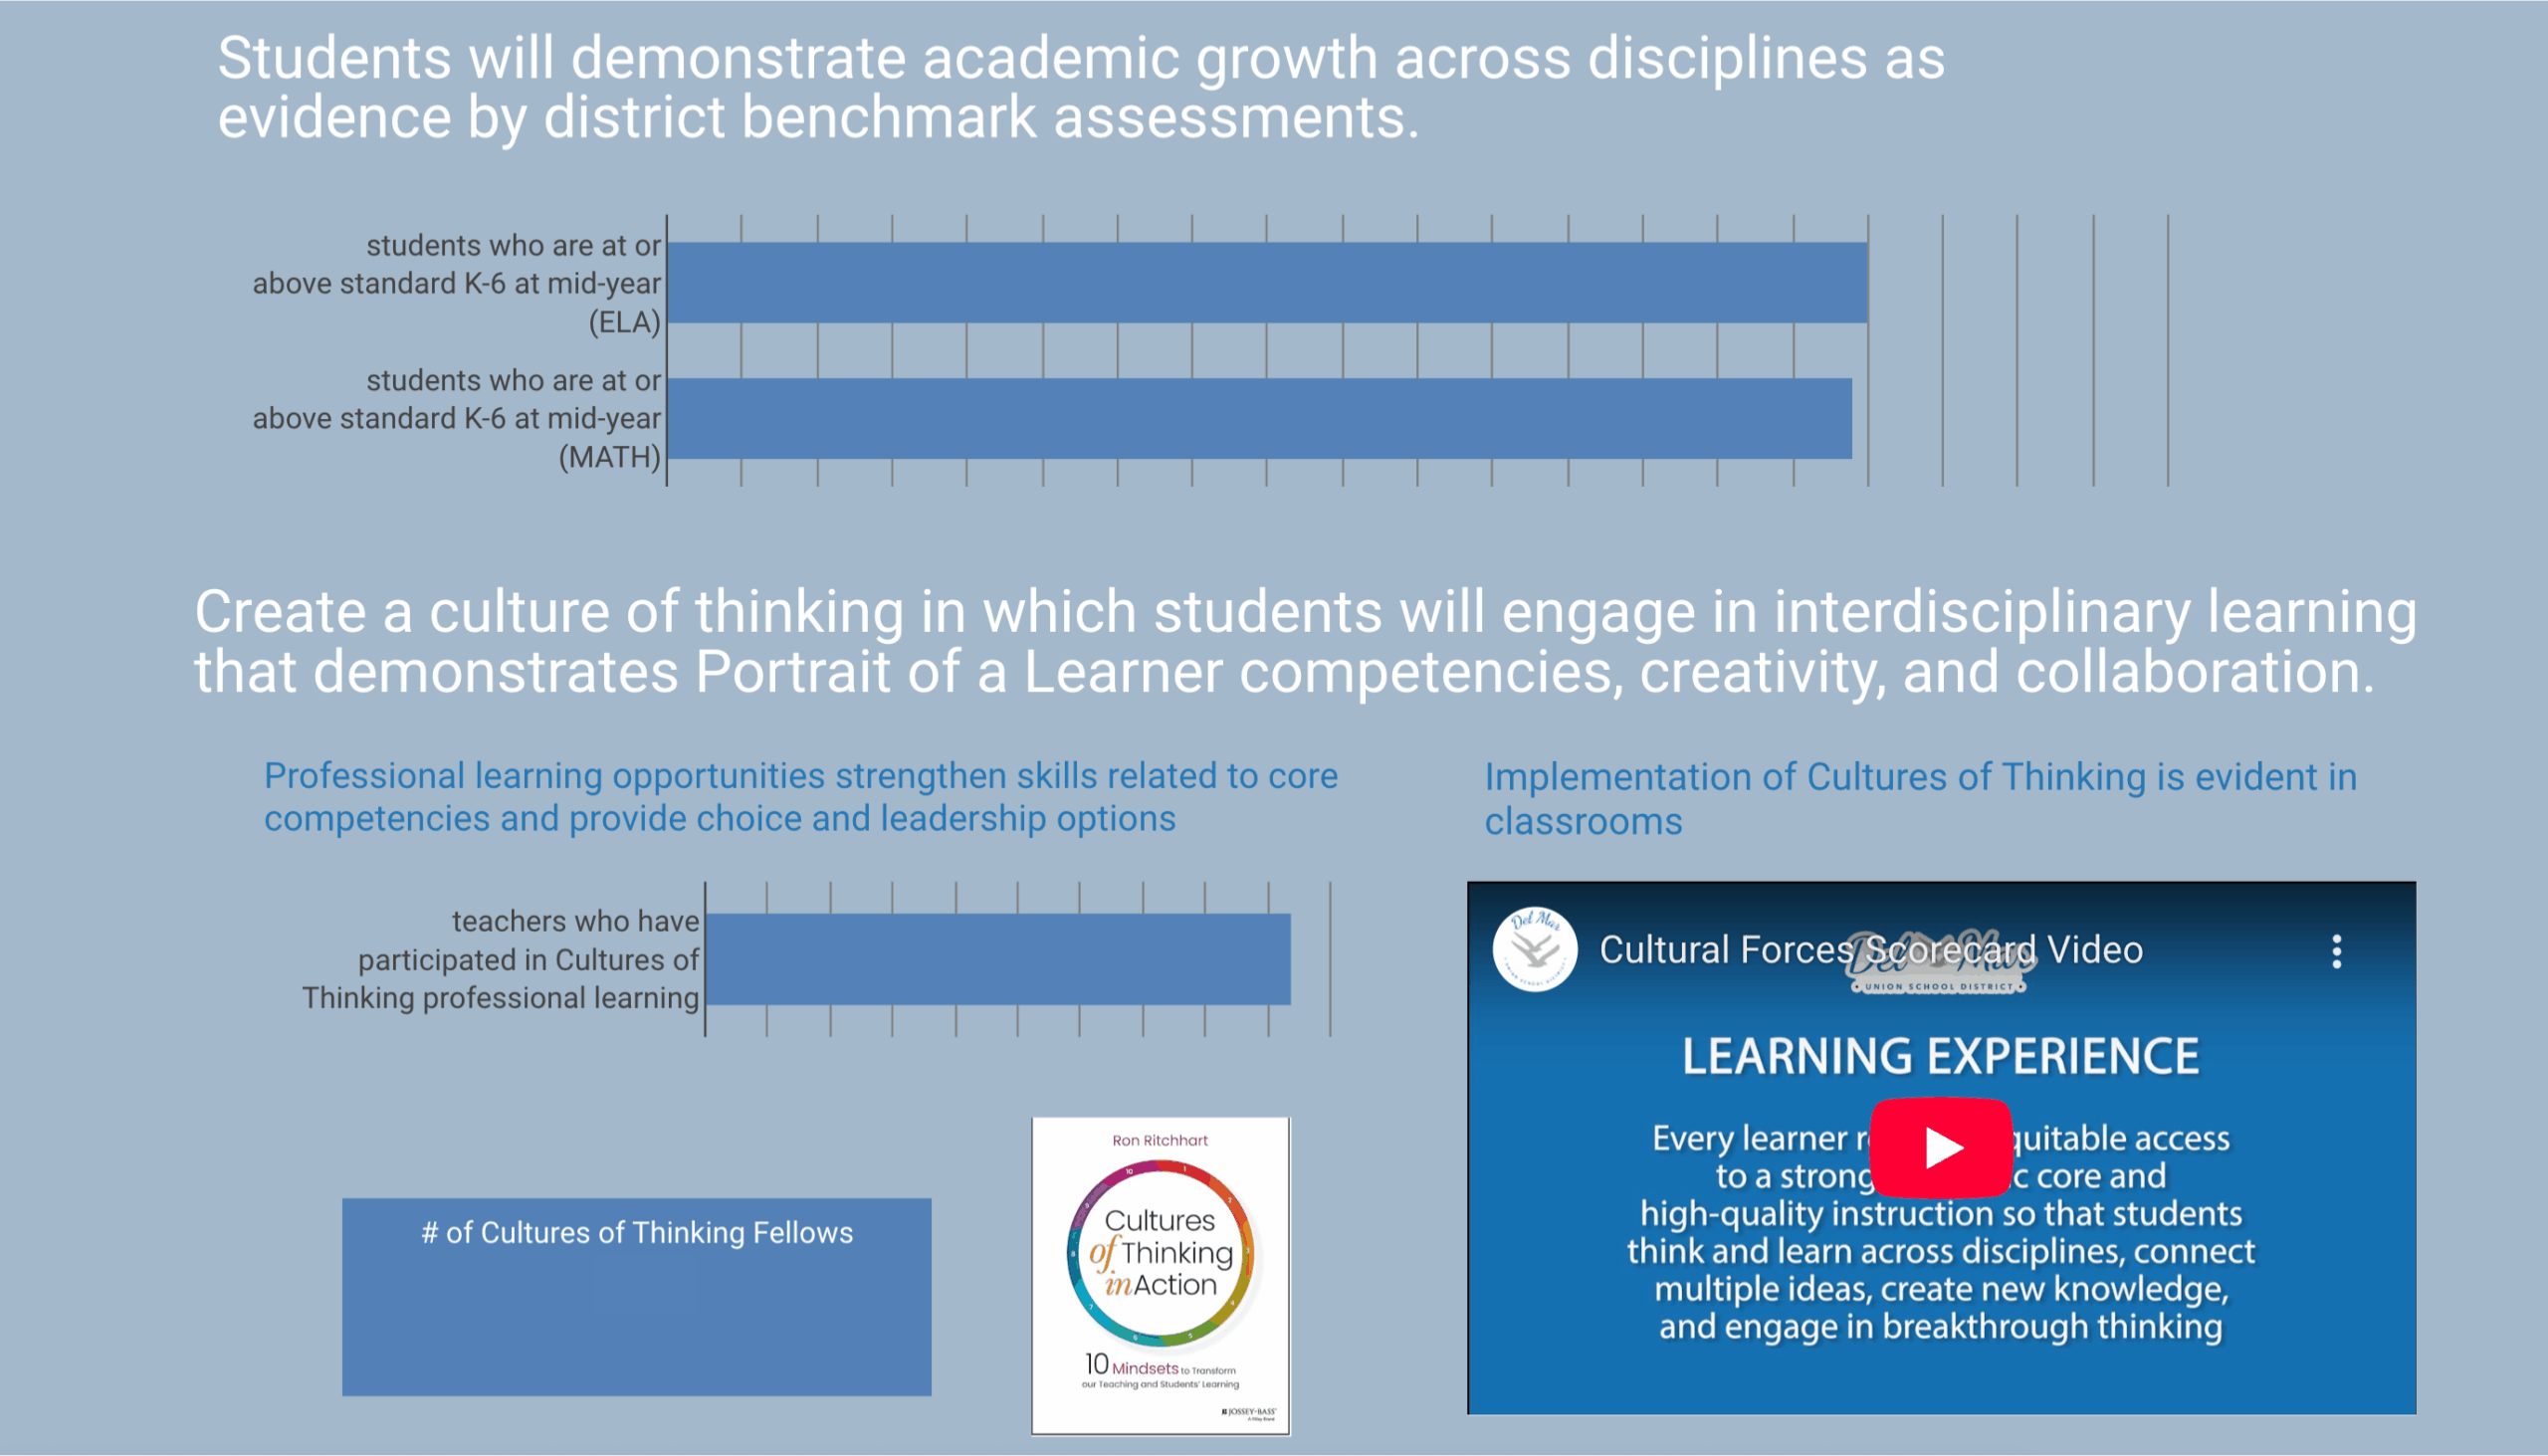
In Del Mar, one of their outcomes focuses on learning experiences: “Every learner receives equitable access to a strong academic core and high-quality instruction so that students think and learn across disciplines, connect multiple ideas, create new knowledge, and engage in breakthrough thinking.” To track their progress toward this outcome, they are measuring district benchmark assessments in ELA and mathematics as well as educator engagement in professional learning opportunities.
When teams see progress on the measures that matter, confidence grows. That confidence becomes self-reinforcing. As systems start to see growth in one area, they often see growth across others.
Ultimately, measurement is about improving practice more than it is about proving success. The power lies in turning data into dialogue, insights into action, and numbers into narratives that bring people together around a shared purpose. As one of our 2024-25 assessment fellows noted in his research on Learner-Centered Collaborative’s work with Hawaiian charter schools’ Scorecard implementation: “Scorecards offer leaders the evidence they need to tell unspoken stories.”
When we measure what matters—and make meaning together—we move closer to realizing our vision: education ecosystems where all learners know who they are, thrive in community, and actively engage in the world as their best selves.
👉 Learner-Centered Collaborative’s Scorecard Institute is a great launchpad for measuring what matters most in your district. To learn more about this opportunity, reach out to us here.